Clinical Medicine’s Top-Cited Researchers: Country Rankings and R Analysis
Country totals tell only part of the story behind the 2026 Stanford–Elsevier list of top-cited scientists. The United States dominates the count of listed clinical medicine researchers, while Switzerland and Denmark lead when the figures are adjusted for population. The gap between those rankings reflects two different questions: where the largest research systems are, and where top-cited researchers are most concentrated.
Clinical medicine is the largest main field in the database. It accounts for 76,155 of 249,310 listed authors, or 31%—more than the next three fields combined. Counting these researchers by country offers a view of the field’s geographic footprint, but interpreting that view requires care: the figures also reflect population, research priorities and how the dataset assigns authors to countries.
What the dataset counts
The analysis uses John Ioannidis’s science-wide author database, developed with Elsevier using Scopus data. The cited release is the August 2026 update, version 9, hosted on Mendeley Data under a CC BY-NC 3.0 license. An author qualifies by ranking among the top 100,000 on a composite citation score or in the top 2% of their main subfield.
For this comparison, the relevant file is the single-year table, which scores citations received during 2025. Each author has a main field in the Science-Metrix classification, stored in sm-field, and a country for their most recent institution, stored in cntry. That country field describes where the researcher works now; it does not identify their nationality or where they trained.
Readers who want to look up an individual or institution can use the scientist search or browse institutions ranked by their number of listed researchers.
Counting countries in R
The calculation is straightforward once the workbook is read correctly: load the data sheet, fill missing countries from the career-country field, filter for Clinical Medicine, then count and sort the country codes. The workbook is about 100 MB, so the download timeout needs to be extended. The code below runs with R 4.6.1, readxl 1.5.0 and tidyverse 2.0.0.
library(tidyverse)
library(readxl)
url <- "https://data.mendeley.com/public-files/datasets/btchxktzyw/files/a517a94c-3fb0-4cee-b97f-f2d476df66f0/file_downloaded"
file <- "Table_1_Authors_singleyr_2025_pubs_since_1788_wopp_extracted_202608.xlsx"
options(timeout = 600)
if (!file.exists(file)) {
download.file(url, file, mode = "wb")
}
authors <- read_excel(file, sheet = "Data") |>
mutate(
filled = is.na(cntry),
cntry = coalesce(cntry, str_to_lower(top_cntry_career))
)
clinical <- authors |>
filter(`sm-field` == "Clinical Medicine") |>
count(cntry, sort = TRUE) |>
mutate(share = n / sum(n))
clinical
## # A tibble: 147 × 3
## cntry n share
## <chr> <int> <dbl>
## 1 usa 28458 0.374
## 2 gbr 6303 0.0828
## 3 chn 3924 0.0515
## 4 deu 3770 0.0495
## 5 ita 3710 0.0487
## 6 can 3140 0.0412
## 7 aus 2943 0.0386
## 8 fra 2120 0.0278
## 9 jpn 2074 0.0272
## 10 nld 1955 0.0257
## # ℹ 137 more rows
Two details in the workbook can quietly derail the result. First, the default download timeout is 60 seconds, which may expire before a large file finishes downloading. Second, the workbook opens on a sheet of column definitions. Calling read_excel(file) without specifying sheet = "Data" reads those 53 definitions instead of the author records.
Some author rows also lack a country in cntry. There are 169 such records across the database, including 77 in clinical medicine—the largest missing-country count of any field. The code substitutes top_cntry_career, the country most often appearing on an author’s papers, and records those substitutions in filled. In the clinical medicine count, that step raises the US total from 28,424 to 28,458.
The US leads in total researchers
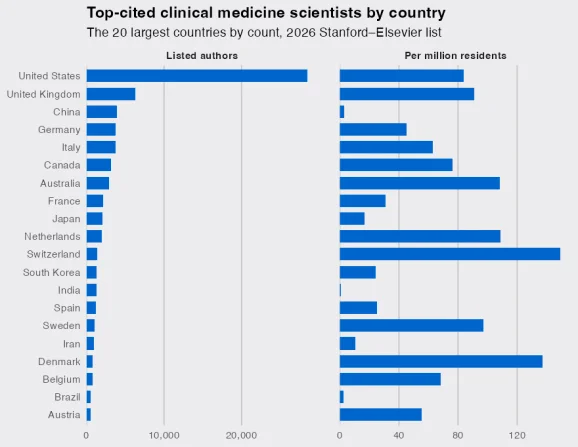
The United States has 28,458 listed clinical medicine researchers, equal to 37.4% of the field total. The United Kingdom ranks second with 6,303, followed by China at 3,924, Germany at 3,770 and Italy at 3,710. Together, these five countries account for 61% of the field’s listed authors. The database includes researchers from 146 countries.
That concentration makes the raw ranking useful for understanding the scale of national research systems, but it says little by itself about how common top-cited researchers are relative to a country’s population. For that comparison, the analysis joins the author counts to 2024 population figures from the World Bank API, using indicator SP.POP.TOTL. Countries with fewer than one million residents are excluded.
Population changes the ranking
On a per-million-residents basis, Switzerland leads with 149 listed clinical medicine researchers, followed by Denmark at 137. The Netherlands records 109 and Australia 108; Sweden has 97.3. The United Kingdom reaches 91, while the United States has 83.7 per million and ranks seventh. Canada rounds out the eight highest entries shown, at 76.1.
China’s rate is 2.8 per million, and India’s is 0.9. The population threshold prevents countries with very small populations from dominating the ranking on the strength of just a few records: without it, Monaco’s three listed researchers would place it among the leaders. Taiwan, with 428 authors, is absent from this table because the World Bank dataset used here does not publish a population figure for it.
Field mix helps explain country totals
Rankings also shift because countries’ listed researchers are distributed differently across disciplines. China has 37,204 authors across all fields, second only to the United States, but ranks third in clinical medicine. Only 10.5% of China’s listed authors have clinical medicine as their main field, compared with 38.6% in the United States and 34.4% in the United Kingdom.
Across all countries in the database, clinical medicine accounts for 31% of listed authors. In China, the largest field is Enabling & Strategic Technologies, with 8,807 authors. The US and UK figures show a stronger concentration in clinical medicine; Germany is similar to the UK at 34.5%, and Australia is at 32.8%.
My read is that a country-by-field ranking measures both its footprint in a discipline and the shape of its research portfolio. The per-capita view adds useful context, while the field mix helps explain why a country with a large overall author count may rank lower in a particular specialty.
Read citation rankings with care
These figures count citations, not research quality. The database’s authors caution against treating the list as absolute evidence of excellence, and that caveat matters when comparing researchers across countries and fields. Citation totals also depend on the database’s selection rules and on the country attached to each author’s most recent institution.
For analysts, the practical takeaway is to keep the denominator and the classification in view. The US leads by total clinical medicine researchers; Switzerland and Denmark lead per resident among countries above the population cutoff. Neither ranking alone captures the full picture, but together they show how much the answer changes when scale and field mix enter the comparison.
This article was first published on DataScience+, a community of R and Python tutorial authors. Have a data-science technique worth sharing? Write for us — no pitch required.
Related posts on DataScience+:
- Machine Learning Results in R: one plot to rule them all! (Part 1 – Classification Models)
- Visualize your Portfolio’s Performance and Generate a Nice Report with R
- Creating Slopegraphs with R
More R tutorials and data science posts are available through R-bloggers.com, which offers daily e-mail updates. Find information about R, learning R, and data-science jobs. To share a post, visit the contributor page or R-Posts.
Comments for the author can be left on the original DataScience+ post. Continue reading the original version via R-bloggers.