Google Cloud VPC Flow Logs Add Kubernetes Workload Context to Network Traffic
Kubernetes traffic logs need context
A flow record that says `10.4.2.18` talked to `10.4.8.44` can be nearly useless in Kubernetes. Pods scale, restart, and move between nodes, so those addresses may no longer point to the workloads that owned them when the traffic occurred. For anyone tracing a connectivity problem, the important question is who was communicating—not just which IPs appeared in a log. Google Cloud’s [VPC Flow Logs](https://docs.cloud.google.com/vpc/docs/using-flow-logs) can attach [Google Kubernetes Engine](https://docs.cloud.google.com/kubernetes-engine/docs/concepts/kubernetes-engine-overview) metadata to sampled traffic at the network layer. That gives you workload attribution for layer 3 and layer 4 traffic without adding agents or sidecars. It’s more significant than it may look: the Kubernetes context stays with the record even if the pod disappears. VPC Flow Logs can also complement CNI and dataplane tools when you need a deeper view inside the cluster.What the records can tell you
When flow logging is enabled on a subnet hosting GKE, records can include the Kubernetes context associated with each pod IP at the time of sampling: - **Cluster:** the cluster name and location. - **Workload:** the pod name and namespace, plus its owning controller, such as a Deployment, StatefulSet, or DaemonSet. - **Service name:** the Kubernetes service that received the traffic. - **Node and zone:** the node VM and its zone at both ends of the flow. Register workloads in [App Hub](https://docs.cloud.google.com/app-hub/docs/overview?e=48754805) and records can also carry `apphubSource` and `apphubDestination` labels. They identify each endpoint’s business application, environment, and criticality. That’s useful when a GKE microservice communicates with an App Hub resource outside the cluster, such as a Cloud Run service.Set up logging and visibility
Before using Flow Analyzer, upgrade the log bucket it reads from to [Observability Analytics](https://cloud.google.com/network-intelligence-center/docs/flow-analyzer/enable-log-analytics), formerly Log Analytics. The usual bucket is `_Default`. The upgrade is permanent, so account for that before running the command: ```sh gcloud logging buckets update _Default \ --location=global \ --enable-analytics ``` You can enable VPC Flow Logs across an organization with one configuration covering every subnet in every VPC network, including subnets used by future clusters. This requires the Network Management Admin role. Keep `include-all-metadata` enabled to retain pod and namespace details; adjust `--flow-sampling`, `--aggregation-interval`, or `--filter-expr` to balance the amount of data against cost and query needs. ```sh gcloud network-management vpc-flow-logs-configs create CONFIG_NAME \ --location=global \ --organization=ORGANIZATION_ID \ --metadata=include-all-metadata ``` GKE Autopilot clusters already have [intranode visibility](https://cloud.google.com/kubernetes-engine/docs/how-to/intranode-visibility) enabled. Standard clusters need it turned on explicitly. Enabling it restarts control plane and node components and adds some per-node overhead, so test the change on a non-production cluster first. ```sh gcloud container clusters update CLUSTER_NAME \ --location=LOCATION \ --enable-intra-node-visibility ```Read traffic patterns in Flow Analyzer
VPC Flow Logs write records to Cloud Logging, where you can search them in Logs Explorer or query them in Log Analytics. [Flow Analyzer](https://docs.cloud.google.com/network-intelligence-center/docs/flow-analyzer/overview), part of Network Intelligence Center, presents those records in interactive charts and tables. You can group and filter traffic by cluster, namespace, workload, pod, or service. The examples below use [Online Boutique](https://github.com/GoogleCloudPlatform/microservices-demo), an open-source microservices demo running on a GKE Autopilot cluster in `us-central1`. Its `loadgenerator` deployment sends synthetic shopper traffic to `frontend`. The frontend then calls `productcatalogservice`, `cartservice`, `currencyservice`, `recommendationservice`, `shippingservice`, `adservice`, and `checkoutservice`.Map dependencies by workload
When investigating an incident or reviewing an architecture change, start with the communicating endpoints and the volume between them. Grouping flows by workload turns a list of temporary IP addresses into a usable dependency map. In Flow Analyzer: 1. Open **Network Intelligence Center > Flow Analyzer** and select **last 1 hour**. 2. Under **Source** and **Destination**, set **Organize flows by** to **GKE workload**. 3. Add the **GKE workload is known** filter to show pod-to-pod traffic. 4. Click **Run new query**.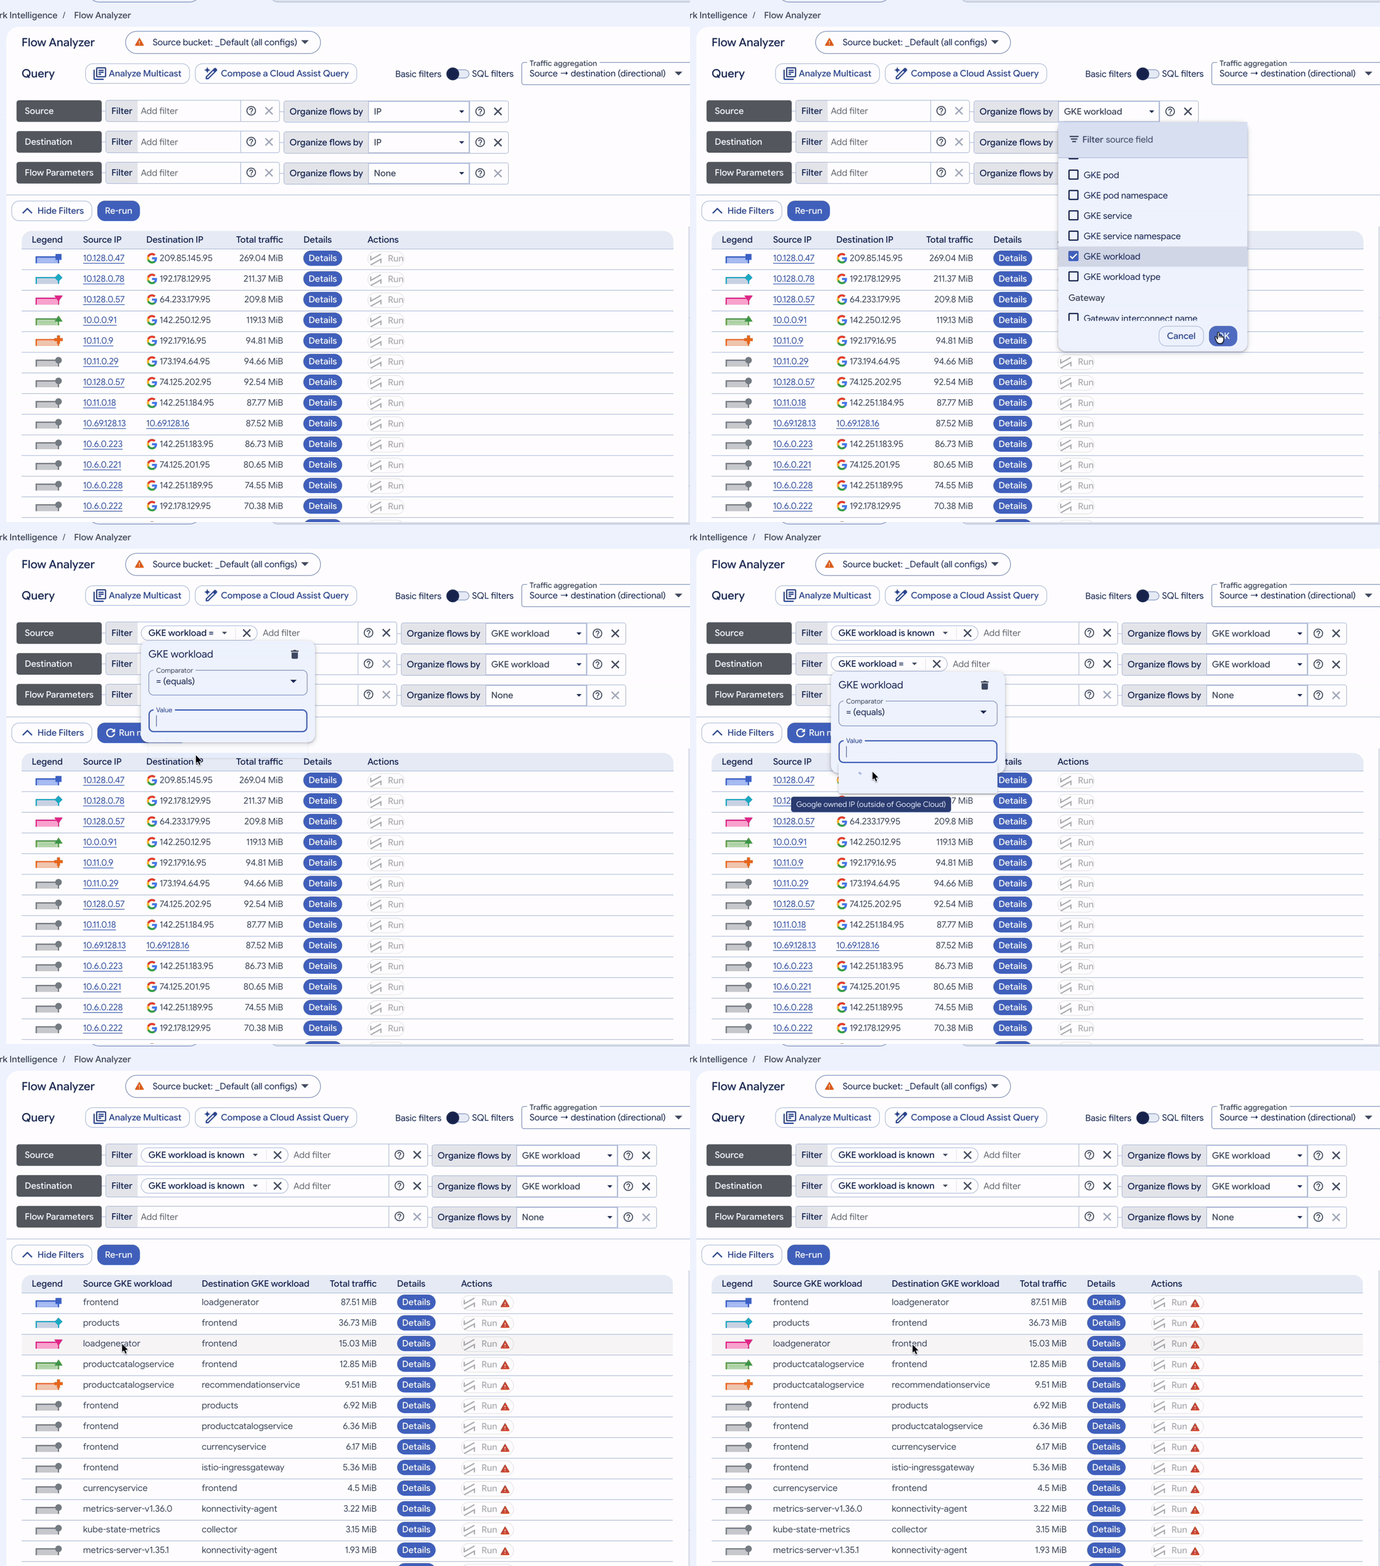 *Grouping traffic by Source GKE workload and Destination GKE workload in Flow Analyzer to map microservice dependencies without raw IP lookups.*
Sort the results by volume and the table becomes a practical map of application dependencies. `frontend` receives traffic from `loadgenerator`, while `productcatalogservice` serves both `recommendationservice` and `frontend`. Workload names also make unexpected or unauthorized communication easier to spot.
Trace callers of a single service
If a service is slow or you’re considering a change to it, caller identity and traffic share help narrow the investigation. For `productcatalogservice`, use bidirectional aggregation so requests and responses between each client and server count together: 1. Set **Traffic aggregation** to **Client ↔ server (bidirectional)**. 2. Under **Server**, filter **GKE workload** to `productcatalogservice`. 3. Click **Run new query**, then select **Details** on the top row.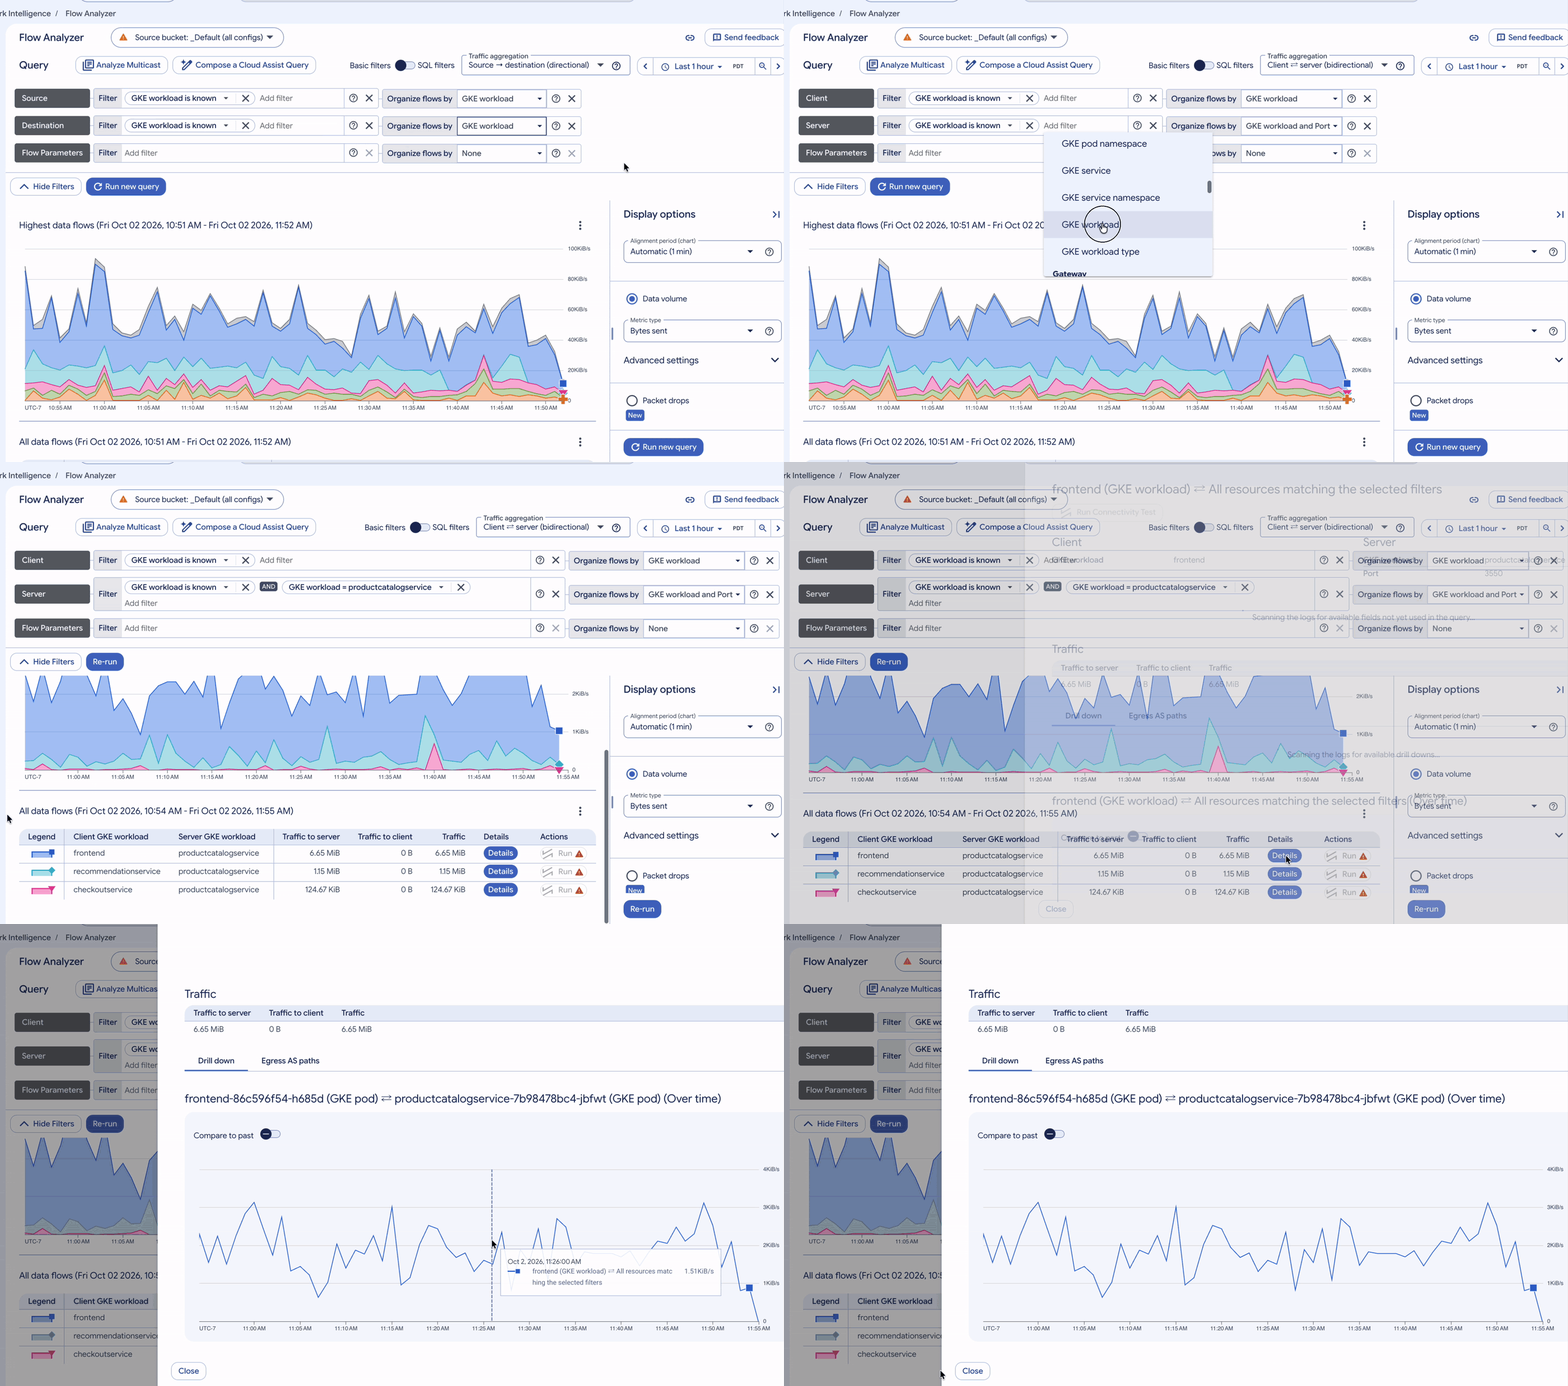 *Filtering on Server GKE workload (productcatalogservice) with Client ↔ server (bidirectional) aggregation to view caller share and the Details timeline.*
The results show each caller, its share of traffic, and a timeline for each client-server pair. If one caller’s traffic rises while the others remain flat, that’s a useful place to start. For latency questions, switch the display mode to latency to rank the same callers by round-trip time.
Find traffic crossing zones
In a regional GKE cluster, frequently communicating services placed in different zones send requests across zone boundaries, which can add inter-zone data transfer charges. Flow records include the zone at both ends, so you can identify the pod pairs responsible. 1. Switch from **Basic filters** to **SQL filters** to compare fields from the same flow. 2. Enter `src_gcp_zone dest_gcp_zone` in the **WHERE** box. 3. Set **Organize flows by** to **Source GCP zone**, **Source GKE pod**, **Destination GCP zone**, and **Destination GKE pod**.Find the cross-zone flows worth fixing
The busiest cross-zone connections are easy to miss in a cluster-wide total. Here, the top flow runs from a frontend pod in us-central1-b to a currencyservice pod in us-central1-c; checkoutservice, shippingservice, and productcatalogservice pairs follow. That ranking gives you concrete candidates to investigate. Use Explore in Log Analytics to open the SQL query and tailor it with joins or time buckets.
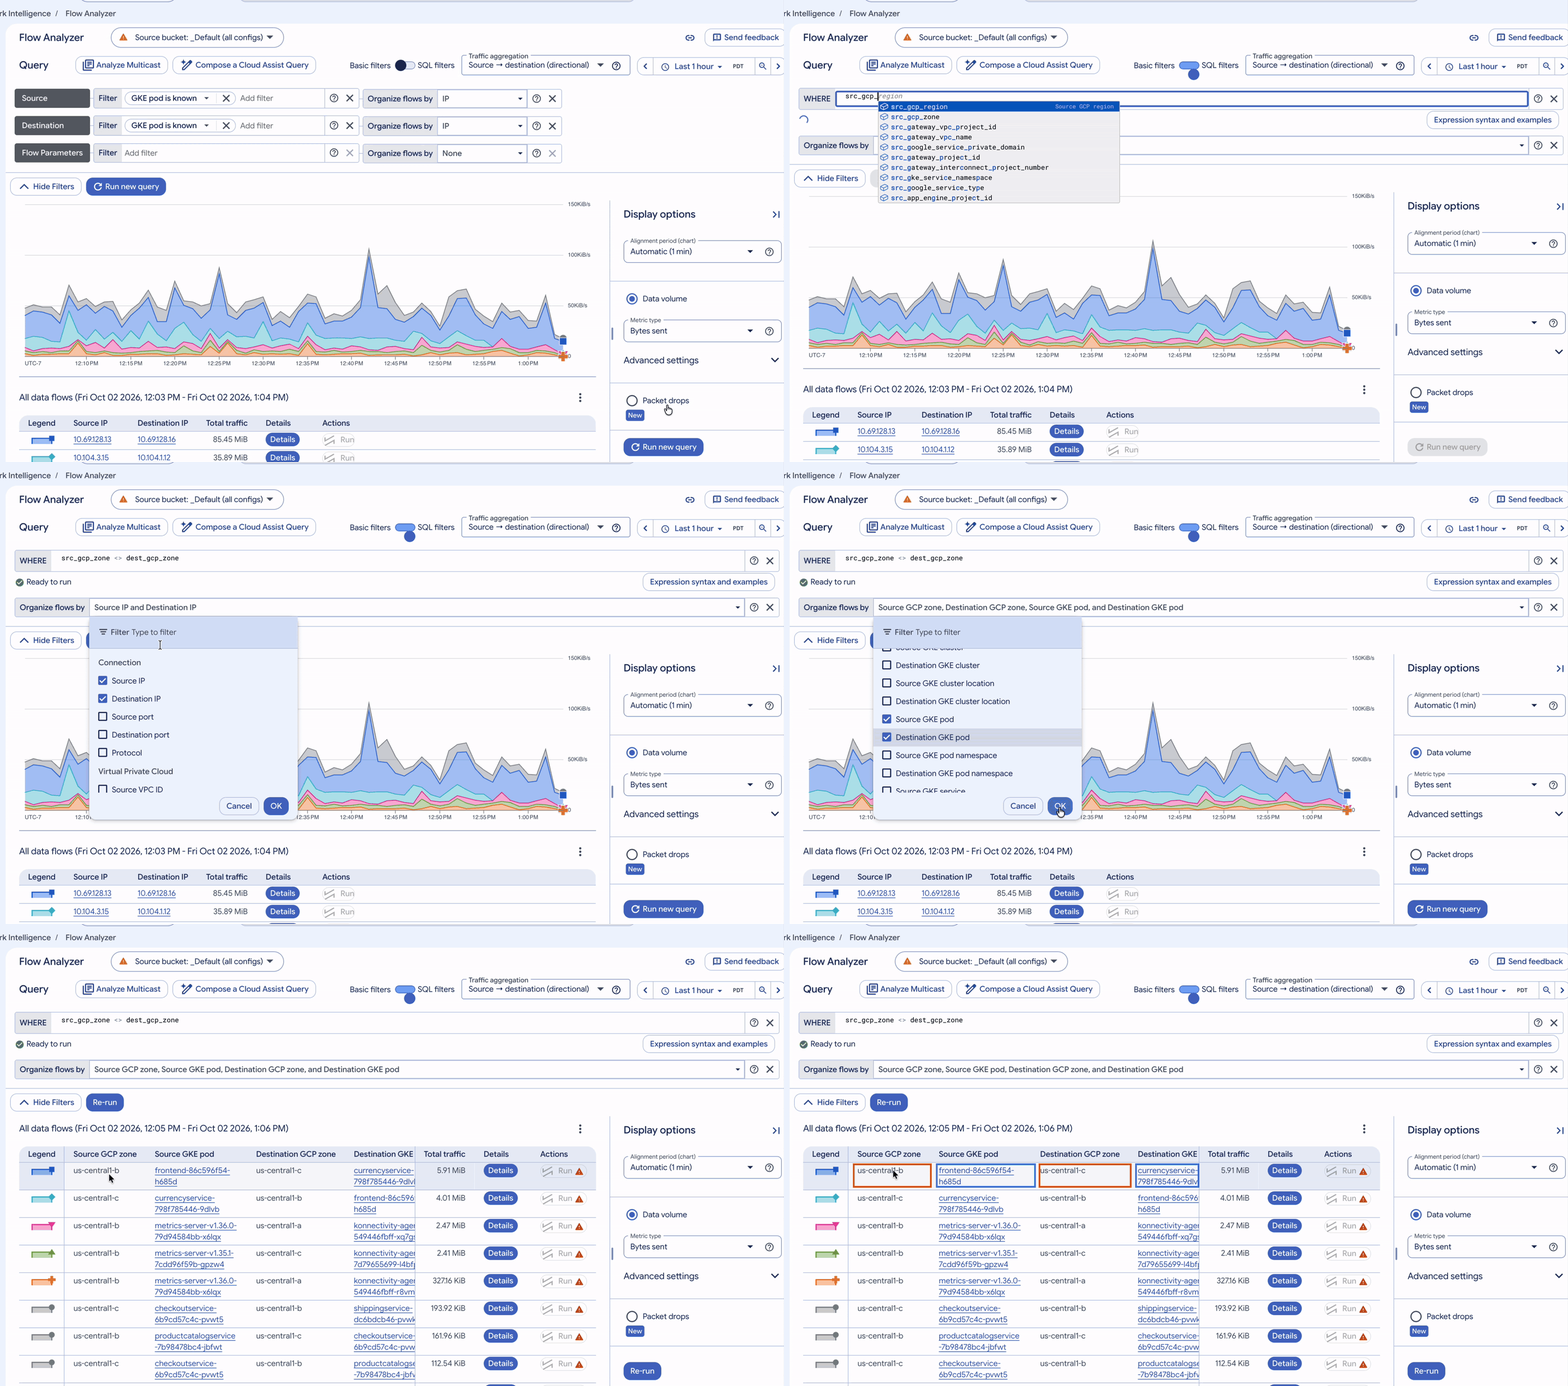
SQL filters for src_gcp_zone <> dest_gcp_zone, grouped by multiple attributes, reveal pod pairs responsible for cross-zone traffic.
GKE offers a direct way to favor local traffic: set trafficDistribution: PreferSameZone on the Service, or use PreferClose on older versions. The setting prefers healthy endpoints in the caller’s zone. It can only help if each zone has enough replicas to handle its own demand.
Know what the logs can and can’t show
- Pod-to-internet traffic: VPC Flow Logs don’t include pod annotations when the masquerade agent replaces a pod IP with the node IP before sampling. Keeping internal destinations on the non-masquerade list preserves pod names for those flows. If
ip-masq-agentruns with intranode visibility, include the cluster’s node and pod IP ranges in that list to avoid connectivity problems. - Blocked traffic: Network policy drops never reach the VPC network, so VPC Flow Logs won’t show them. Use NetworkPolicy logging to investigate.
- Sampling: Flow logs are sampled. Their byte and packet counts are useful for ranking and tracking trends, but they aren’t per-connection accounting.
Put the walkthroughs to work
If VPC Flow Logs are already enabled for your clusters, upgrading the _Default bucket and opening Flow Analyzer is enough to reproduce the three walkthroughs. The practical value is in connecting those summaries to a specific pod pair, then deciding whether placement or service traffic preferences can reduce cross-zone traffic.