AlloyDB Omni Web UI Brings Read-Only Monitoring to PostgreSQL Clusters
A browser console for distributed PostgreSQL
AlloyDB Omni’s new Web UI puts cluster diagnostics in a browser-based, read-only console for teams running PostgreSQL across data centers, edge sites and cloud environments. Now generally available for Red Hat and container deployments, it brings hardware telemetry, query performance and database settings into one view while leaving administrative changes to existing tools and workflows.
That combination addresses a familiar operational problem: signals about a database often sit in separate monitoring systems, query tools and configuration files. A shared console can shorten the path from noticing a symptom to investigating it, especially when a team supports installations in several environments. It won’t remove the need for those underlying systems, though; the UI’s value depends on what they report and how operators already manage their deployments.
One console for cluster health and SQL load
The console groups observability around two questions: whether the host is under pressure, and which database work is driving it. With standard Prometheus monitoring configured on the host, administrators can inspect CPU, memory, storage I/O and active connection trends. Those signals provide operating context for database behavior: a rise in query latency, for example, is easier to assess when it can be viewed alongside host resource use.
Query views rank statements by total latency and call frequency, helping teams find slow or resource-intensive SQL, including queries that may benefit from indexing. These rankings are useful starting points, not diagnoses on their own. A frequently called statement and a statement with high total latency can point to different kinds of workload pressure, and operators still need to examine the query and its context before deciding what to change.
Saved connection profiles make it possible to move among local development, staging and production targets without repeatedly switching command-line contexts. That can reduce friction during routine triage, particularly for teams that move between environments throughout the day. Because the interface is read-only, it supports investigation without executing write commands or changing database configuration.

System Insights and Query Insights in AlloyDB Omni Web UI
Inspecting the Columnar Engine and AI workflows
AlloyDB Omni’s in-memory Columnar Engine is designed to speed analytical queries. The Web UI exposes its memory use and shows which tables and columns are cached, giving operators a way to check coverage and compare consumption with available hardware capacity. That visibility matters because acceleration features have to fit the actual workload and host: cache use is operational information, while decisions about what to cache remain part of tuning.
If you're working in this space, the useful question is whether the cached data aligns with the queries you need to accelerate. A view of memory consumption can help frame that review, but it doesn’t establish that an analytical workload is performing well by itself. Teams still need to connect these indicators to their own query behavior.
The console also surfaces AlloyDB AI vector search workflows and model integrations. A tooling hub provides shortcuts to documentation and ecosystem resources, including the backup tool pgBackRest. These links put related tasks closer to the diagnostics interface, though the console’s description centers on visibility and access to resources rather than replacing the tools themselves.

AlloyDB AI and Columnar Engine Insights in AlloyDB Omni Web UI
Configuration visibility, with changes handled elsewhere
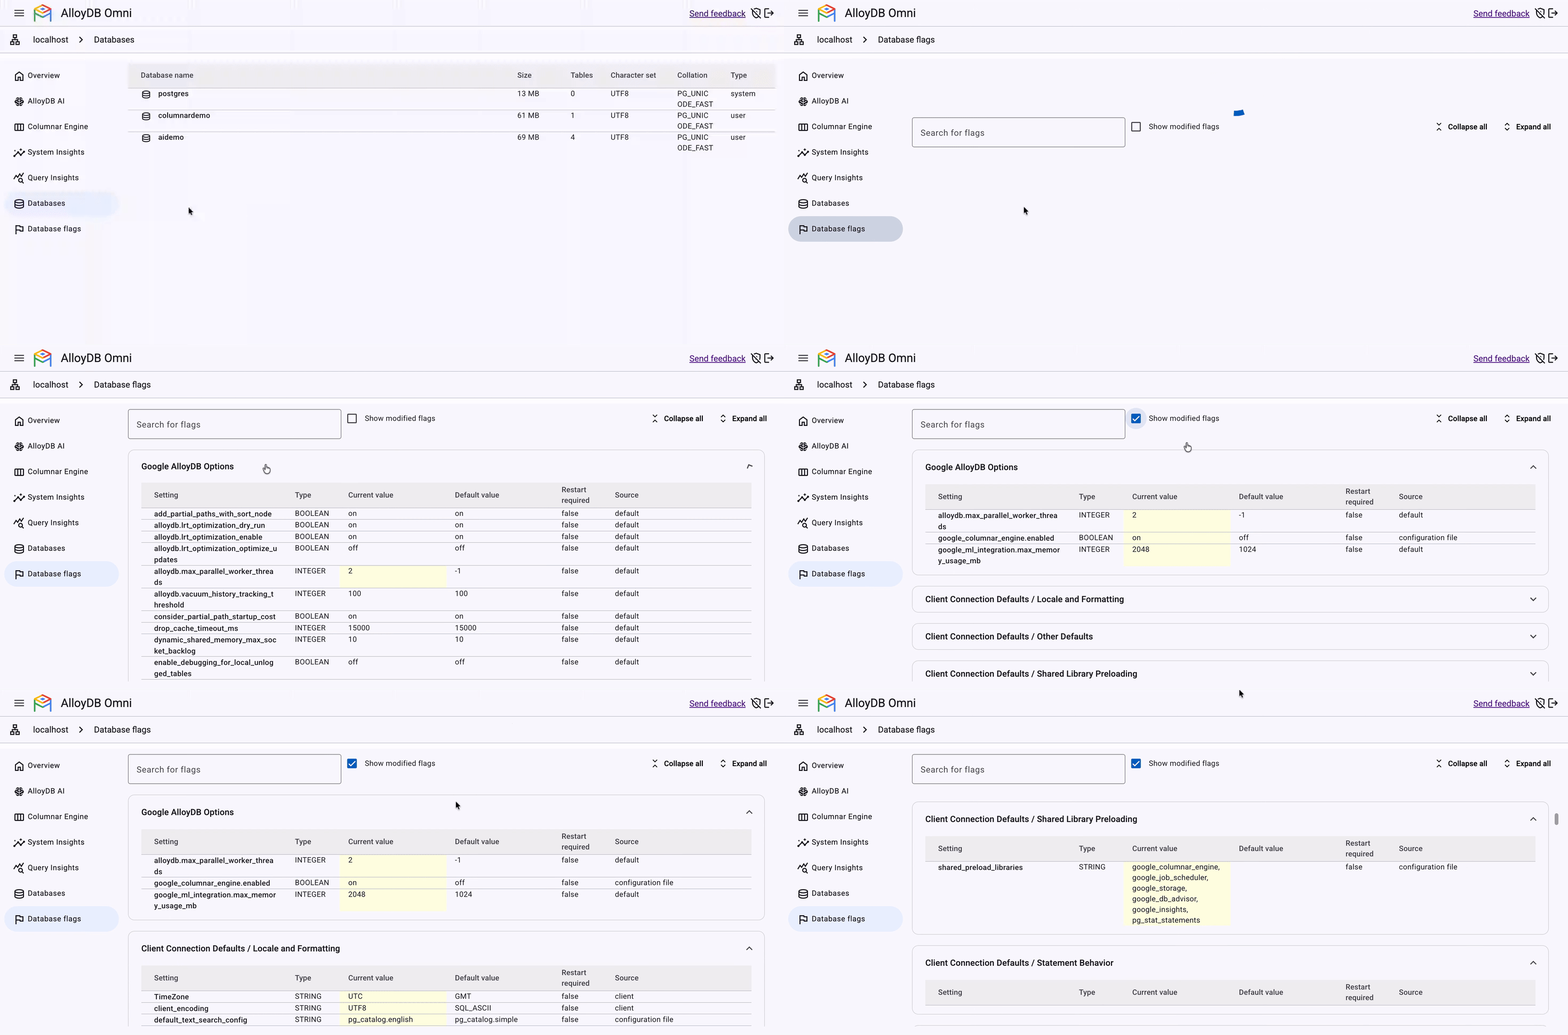
Database flags and runtime parameters appear in a central catalog, making it easier to compare settings across nodes and spot drift from organizational baselines. In distributed operations, that comparison can help teams distinguish a shared configuration from an exception that may explain different behavior between nodes. The catalog makes settings easier to inspect; it doesn’t determine which values are appropriate for a particular workload.
The UI is for inspection; teams should apply corrections through their established provisioning process, such as Kubernetes CRDs or GitOps manifests, Ansible playbooks, or alloydbctl. That boundary is a sensible one for environments where configuration is managed as code: changes continue to pass through the team’s existing review and deployment habits. The trade-off is that the console won’t complete the fix after an operator spots a discrepancy.
Database flags in AlloyDB Omni Web UI
Deployment and access
AlloyDB Omni is a downloadable, self-managed edition of AlloyDB that runs on customer infrastructure and remains compatible with PostgreSQL. It includes columnar acceleration and AI tooling, and is intended for transactional and analytical workloads where teams need control over the operating environment. That self-managed model makes the deployment environment part of the operator’s job, which is why visibility into both host conditions and database settings is relevant.
The Web UI is available for Red Hat RPM and container deployments, including Docker, Podman and Kubernetes. It uses minimal permissions and is designed to fit within enterprise security boundaries, including air-gapped environments. Complete hardware metrics depend on Prometheus monitoring being configured on the host, so teams should expect the depth of host-level visibility to reflect their monitoring setup. A console with gaps in its input data can still help with database inspection, but it won’t show a complete picture of system health.
Access to the Web UI and advanced tooling is requested through separate forms for RPM-based and container-based enterprise distributions. Installation instructions are available for each deployment path.
-
Request access to RPM-based enterprise distributions, advanced tooling, and the Web UI through the sign-up form for RPM based deployment.
-
Request access to container-based enterprise distributions, advanced tooling, and the Web UI through the sign-up form for container-based deployment.
-
Follow the installation instructions for Red Hat RPM deployment or container deployment.
What the console changes for operators
For distributed PostgreSQL operations, the practical value is a faster path from a host-level spike to the SQL or configuration details that may explain it, with provisioning authority staying in the team’s existing workflows. This is more significant than it looks when operators need to compare what’s happening across environments without first assembling clues from several interfaces.
And yet, a browser view is only as useful as its telemetry, query data and connection setup. The Web UI gives teams another place to inspect those signals and related settings; it doesn’t remove the work of interpreting them or maintaining the systems that supply them. That’s a measured addition, and probably the right shape for a read-only tool.
One practical caveat. (And this is the part most people overlook.)
For teams evaluating it, the key question is whether a shared diagnostic view fits the way they already observe and provision AlloyDB Omni. If it does, the UI can make investigation more direct while keeping changes in familiar workflows. If it doesn’t, the console may become one more screen to check.