Kubernetes v1.36 Introduces GA for PSI Metrics: Enhancing Resource Management
As Kubernetes continues to evolve, a pivotal new feature gaining traction is the implementation of Pressure Stall Information (PSI). Launched initially in the Linux kernel in 2018 and introduced in general availability with the recent Kubernetes v1.36, PSI empowers developers to monitor resource availability with superior granularity. At its core, this innovation allows real-time insights into how much time workloads spend stalled due to resource constraints, such as CPU, memory, and I/O, instead of just measuring resource utilization percentages. This insight becomes critical as applications scale and performance becomes more dependent on efficient resource management.
The Hidden Costs of Traditional Monitoring
Standard metrics like CPU utilization can paint a deceptive picture of workload performance. An instance might show, for example, that CPU usage is sitting comfortably at 70 percent, yet can mask serious performance bottlenecks caused by resource scheduling delays. PSI offers a more nuanced view. By revealing how long processes are stalled, it enables Kubernetes administrators to identify issues preemptively, rather than reacting to an outage after it occurs. Notably, PSI metrics can provide cumulative totals of stalled time and moving averages over various intervals, which help distinguish between temporary spikes in resource contention and sustained issues.
Testing Validity and Performance
A pressing concern accompanying the introduction of new telemetry features has typically been the overhead they impose on resource consumption. To ensure that PSI operates efficiently, extensive performance validation was undertaken by the Special Interest Group for Node (SIG Node) under high-density workloads. Testing involved scenarios designed to isolate the effect of Kubelet and kernel-level metrics collection.
Assessing Kubelet Overhead
The test compared two conditions: one where kernel-level PSI was active but Kubelet's feature was off, against a condition where both were enabled. The results showed no significant difference in CPU usage—remaining within a minimal increase that accounted for only about 2.5% of total node capacity. This light footprint indicates that enabling PSI-related metrics will not strain system resources and can be safely scaled in production environments.
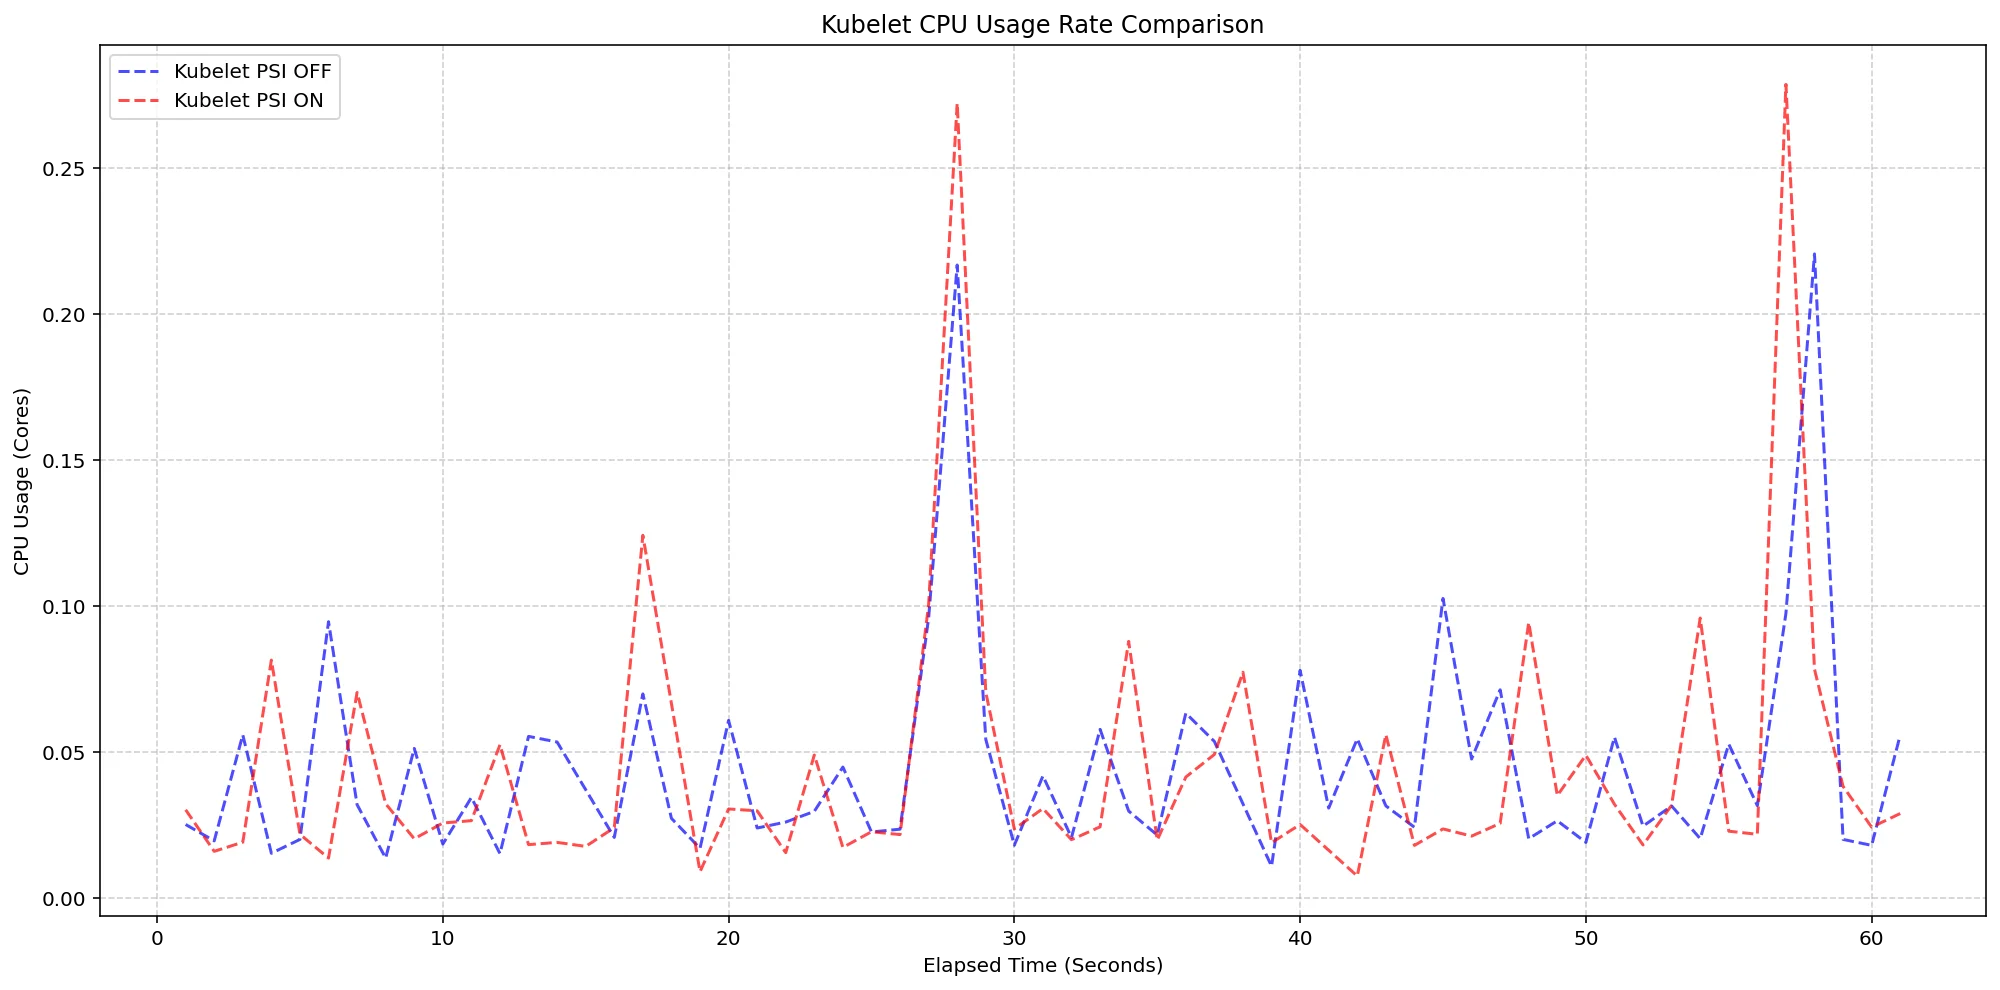
(Case 1) Kubelet CPU Usage Rate Comparison
Figure 2: Kubelet CPU Usage Rate Comparison.
Kernel-Level Efficiency
A similar assessment focused on the kernel itself revealed that even under intensive workloads—with 80 pods running—the extra CPU load attributed to kernel PSI was negligible, peaking only at around 5.6% during brief bursts. The data solidifies confidence in the kernel's ability to manage PSI without substantial performance overhead.
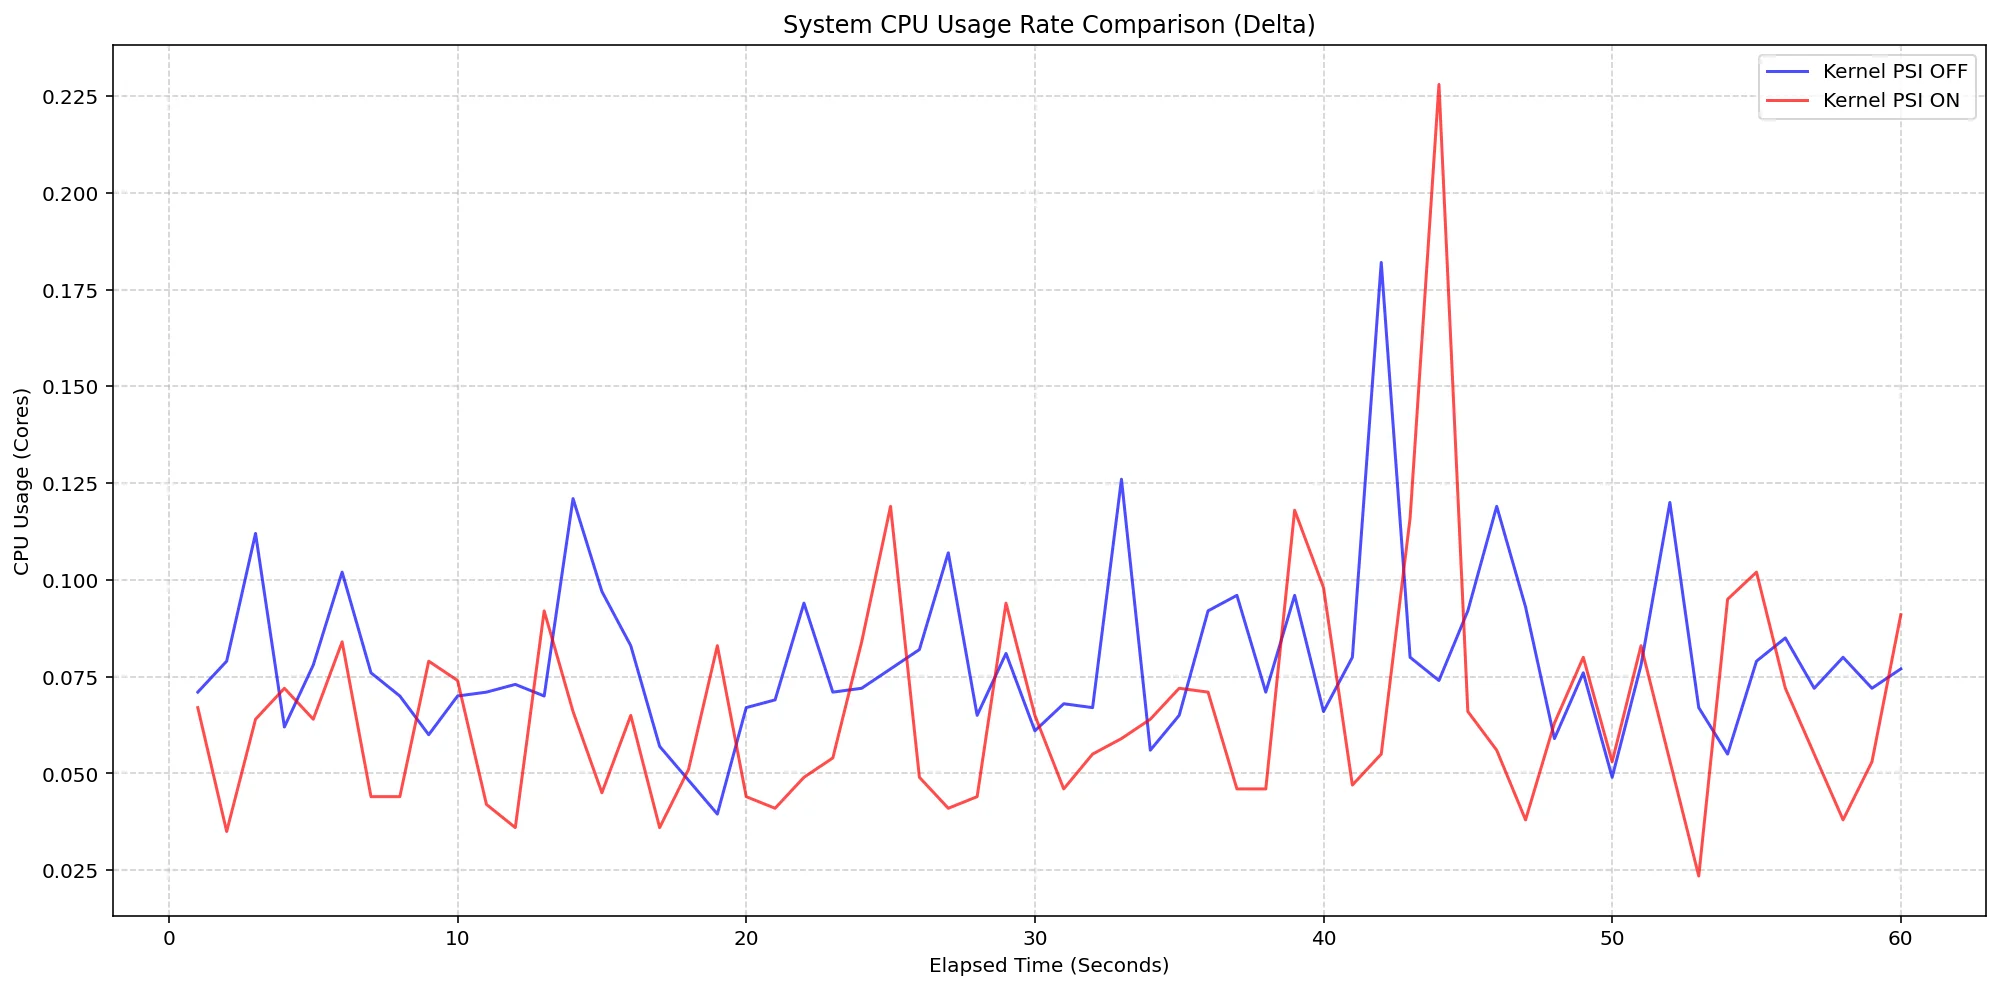
(Case 2) Node System CPU Usage Rate Comparison
Figure 3: Node System CPU Usage Rate Comparison.
Strategic Improvements from Beta to GA
A noteworthy improvement transitioning from the beta version (v1.34) to the stable release (v1.36) is the Kubelet’s ability to intelligently handle PSI metric emissions. Previously, if the underlying Linux kernel did not support PSI, the Kubelet would emit misleading metrics that could trigger false alarms. With v1.36, the Kubelet now preemptively checks OS-level support before reporting metrics, drastically improving data reliability. This change enhances monitoring precision and reduces alert fatigue among system operators.
Getting Started with PSI in Kubernetes
Implementing PSI metrics in a Kubernetes environment requires some specific prerequisites. First, ensure nodes operate on a Linux kernel version of at least 4.20, with control groups (cgroups) set to version 2. Furthermore, enabling PSI is contingent on the kernel being compiled with the necessary configuration options. Starting with v1.36, the PSI metrics are available without needing to enable any specific feature gate, simplifying the setup process for Kubernetes administrators.
Once these conditions are met, metrics can be accessed via the accessible /metrics/cadvisor endpoint using any Prometheus-compatible monitoring setup or through the Summary API. This allows organizations to leverage PSI insights for optimizing workloads and resource allocation. However, note that this feature is explicitly designed for Linux nodes, and thus will not be available on Windows nodes in a mixed-cluster environment.
Caution: Engaging in proxying to the Kubelet's HTTP API carries security risks, necessitating careful management of access permissions.
Final Thoughts on the Evolution of Kubernetes Monitoring
The introduction of PSI into Kubernetes not only streamlines the approach to resource monitoring but serves as a reminder of how technological advancements must adapt to the needs of users grappling with complex systems. PSI equips engineers with direct insights into the efficiency of their container workloads, enabling proactive management and fostering operational resilience. By concentrating on stalled tasks rather than just resource utilization, organizations can better prepare for the challenges posed by increasingly complex cloud-native architectures. As Kubernetes solidifies its presence in the market, initiatives like this showcase its commitment to continuous improvement and optimization.